| Home Blogs | Copyright 2022, Randy Strauss |
In an April 21, 2022 Washington Post article, they quoted 4 examples given by the Florida Department of Education for banning math textbooks. The first was valid.
This first example should not be barred for being about racism. But it should be barred for being political and misleading.
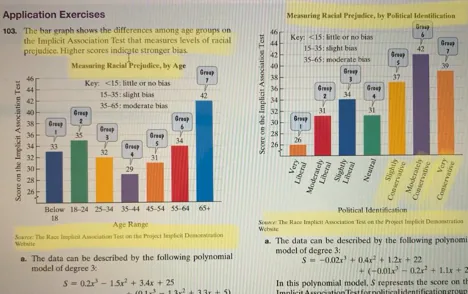
The image is extremely prejudicial against conservatives. Visually, it shows conservatives as much more biased racially than liberals. Do you see why?
The bar charts are visually misleading. The length of the bars of the right-hand chart show the bar for very-conservative people's racial prejudice being 7.5 TIMES longer than the one for liberal people! It's falsely implying that few liberal people are biased, or conservatives are very biased!
But that's not what the numbers actually say. The numbers say the difference is that conservatives are 11-13% more biased, about half the difference between slight-bias to moderate-bias, or little to slight bias.

The chart uses a common but bad practice. The graph shows the range of bias score from 25 to 46. So for very-liberal people, the bar with a score of 26 shows just one unit of length, as if they had almost no bias. For the very-conservative people with a score of 39, the bar has a length of 7.5 units. While the conservative score is exactly 50% larger, the bar is 7.5 times longer! And since the chart only goes up to 46, the bars for 42 and 39 go almost to the top, giving the false impression that conservatives are almost completely prejudiced.
Together, these bias us into thinking that conservatives are much more biased.
The whole point of graphs is to give us a faster way to understand data. This graph is horrible. To understand the data, one must ignore the graph or at least study it in very close detail.
Plus the words don't say what the scores really mean. If they measure the frequency of bias linearly, if someone scores 50% more (from 26 to 39), it means the conservative shows bias 3 times for every 2 times a liberal shows it. That's pretty similar! I imagine if I were at a party and one person made 2 racially biased remarks and another person made 3, I wouldn't think those people were much different.
The "Key" says the liberal scores are in the "slight bias" range and conservatives are in the "moderate bias" range, which sounds worse. Yet the moderately liberal people scored in the top half of the "slight" range while the conservatives scored in the bottom quarter of the "moderate" range. To me, the labeling of these ranges seems cherry-picked to be prejudiced against conservatives. As an example, "slightly liberal" people with a score of 34 fall into the most biased 12% of the "slight bias" group while "slightly conservative" people with a score of 37 fall into the bottom 6% of the "moderate bias" group. These scores are almost the same!
Note that the categories are for the first 15 point (slight)s, the next 20 points (moderate), and the following 30 points. Instead, if we make the groups each 25 in size, then everyone is in the second group!
Plus, the distribution of scores is missing. All of the scores of the "very conservative" people are aggragated in one score. If none of those people had low scores, that suggests that conservative people tend to be biased which leads us to fault conservative philosophies. If there were a range of scores in each group, that suggests that more biased people tend to be conservative, which is different. So the real lesson would be that the prejudiced people tend to "bias" the score of conservatives more than they bias the score of liberals.
To me, the scores just say that America has racial bias, and it's not limited to conservatives. A lesson about these interpretations of the data is probably much more valuable than the math lesson.
The problem as presented in the book was much too biased politically to appear in math books. The data in the study is real. While it would be great if the actual lessons in the math book have the students work through these issues, I doubt it does. And I doubt most kids can learn the math and think through the issues at the same time. Certainly the people reviewing the text could not.
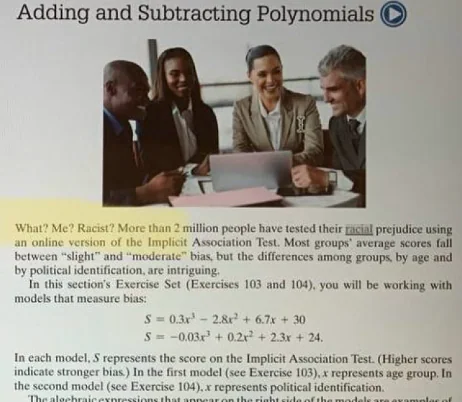
This second image seems fine. It seems to be highlighted as unacceptable just because it mentions racial prejudice. That seems like a dumb reason to disapprove of a book.

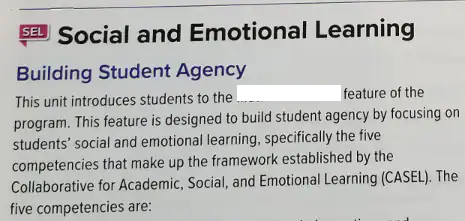
My only guess why this next one is a problem is because it contains "SEL" or has the word "empathizing." These seem like very dumb reasons to disapprove of a book.

The fourth example mentions social and emotional learning (SEL). Note the the 5 competencies of SEL are:
If DeSantis honestly believes SEL shouldn't be taught, why? I don't believe anyone thinks people shouldn't have these skills. Maybe he believes schools will make kids worse by teaching them? It'd be interesting to see him interviewed about it.
So my best guess is that DeSantis' problem with SEL is purely political. He wants to label it "liberal" just so he has something more to demonize. By demonizing SEL, which is almost universally desired by educators and informed parents, he's sure of being able to make poorly-educated and gullible voters angry.
From this page, benefits of teaching SEL include:
These conclusions are from a meta-analysis of 213 studies involving 270,000 students. Making SEL political is completely unjustified.

Rand Strauss is an expert problem solver and software engineer, and the founder of PeopleCount.org which promises to transform America's political system into one we love, including freeing politicians from the influence of money and the parties.